Facebook joined our lives in 2016, and at this point, it’s hard to imagine a life without or before Facebook (or any other social media app, to be honest).
Because the platform evolves constantly, staying on top of Facebook statistics like demographics, usage, video, and advertising is the key.
In this article, I've put together a list with the most essential and powerful Facebook stats every marketer should know in 2021.
Let's dive in!
2021 Powerful Facebook stats
1. Facebook demographic stats
Find out in-depth Facebook demographics and understand which segment group is more active on Facebook.
1.1. Male users - the biggest demographic group of Facebook users
In 2021, on Facebook, only 9.6% of global active users are women between the ages of 18 and 24 years.
Male users between the ages of 25 and 34 years represent the most significant demographic group of Facebook users, according to Statista.
More precisely, 18.8%. Take a look at the graphic below.

1.2. Monthly active users
With almost 2.85 billion monthly active users, Facebook is the biggest social network worldwide, according to Statista.

Compared with other social networks, Facebook is the largest social app regarding the monthly active users metric:
- YouTube has 2.3 billion
- Instagram 1 billion
- WeChat has 1.2 billion
- TikTok 689 million
- LinkedIn has 303 million
- Twitter has 330 million
- Snapchat has 500 million
2. Facebook usage stats
Get a preview of how people use Facebook, how businesses advertise, and how B2B marketers act on this platform.
Here are some Facebook usage stats that everyone should know in 2021. 😉
2.1. Facebook fake & duplicate accounts
11% of Facebook's worldwide monthly active users are duplicate accounts, and approximately 5% are false accounts, according to Facebook. 😱
- 11% of Facebook accounts are duplicate
- 5% of Facebook accounts are false
We estimate that duplicate accounts may have represented approximately 11% of our worldwide MAUs, and false accounts may have represented around 5%. said Facebook.
Several of these accounts are from Vietnam and the Philippines.
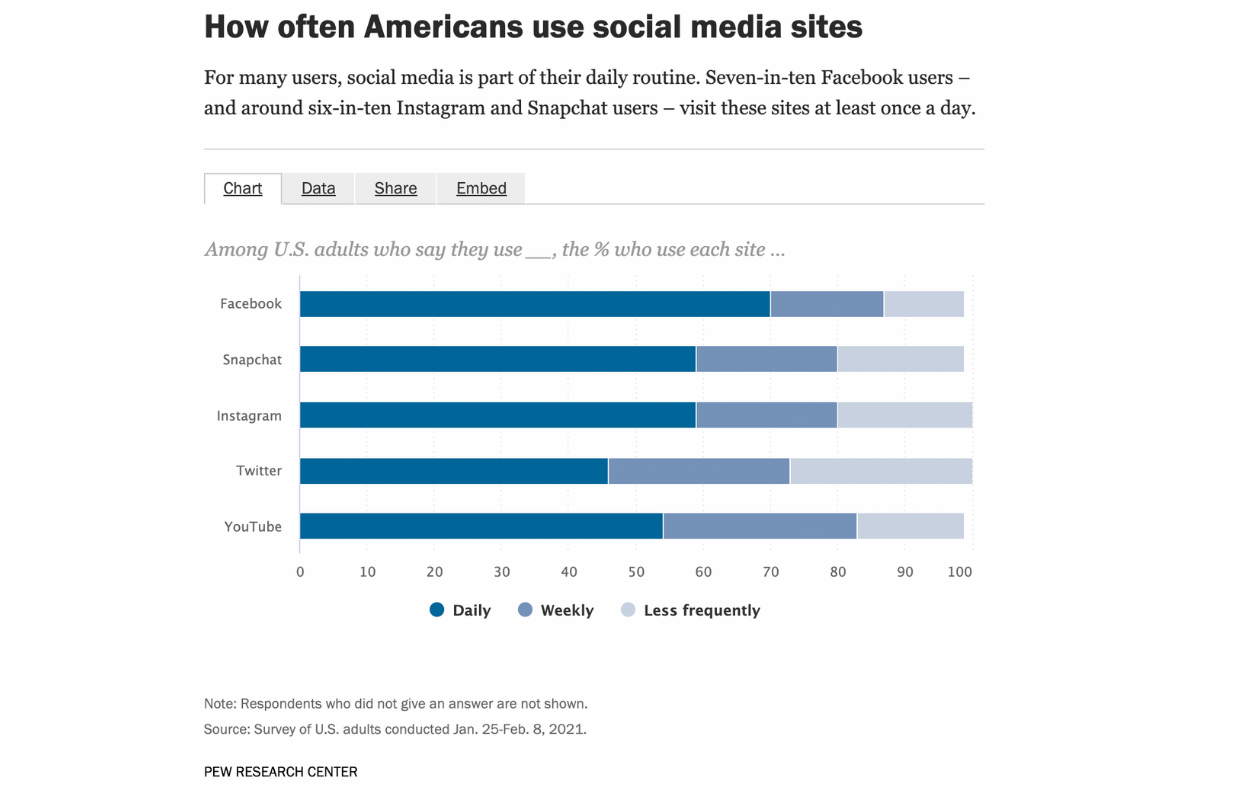
2.2. 70% of U.S. users log in daily on Facebook
According to a survey by Pew Research Center, 7 in 10 U.S. Facebook users visit the app at least once per day.
70% of Facebook users log in daily on the app, 17% weekly, and only 12% less frequently.
- Snapchat: 59% daily, 21% weekly, 19% less frequently
- Instagram: 59% daily, 21% weekly, 20% less frequently
- Twitter: 46% daily, 27% weekly, 27% less frequently
- YouTube: 54% daily, 29% weekly, 16% less frequently

2.3. 2 hours and 24 minutes per day on Facebook
Facebook is the most popular platform, costing people to spend, on average, 2 hours and 24 minutes per day.
2.4. 1.8 billion people use Facebook Groups
Facebook groups are the original tools to help people create new connections, learn things about social media and not only, ask questions, and get answers.
A recent study by Facebook shows that 1.8 billion people use Facebook groups monthly.
People can experience a strong sense of community from membership in Facebook groups despite the lack of physical proximity.
2.5. India - the country with the most Facebook users
With more than 320 million Facebook users, India is the first country in terms of Facebook audience size, according to Statista.
In the second place, we have the United States with 190 million users, followed by Indonesia with 140 million users.

2.6. Number of Facebook users in the United States from 2017 to 2025
According to Statista, by 2025, the number of Facebook users is expected to reach 235.15 million in the United States.

3. Facebook video stats
3.1. 100 million hours of videos are watched on Facebook every day
Video is taking over social media.
With Facebook constantly growing and introducing new features, your video marketing strategy has to evolve, too.
According to some studies, 100 million hours of videos are watched on Facebook every day, so don't waste time and create your first Facebook video.
This Socialinsider's Facebook video study will help you.
3.2. 15% of all Facebook content is video
In 2020, 15% of Facebook content was video.
A clear contrast to 2014, where the number of video posts published by brands on this platform made up for only 5.47%, according to our latest Facebook video study.
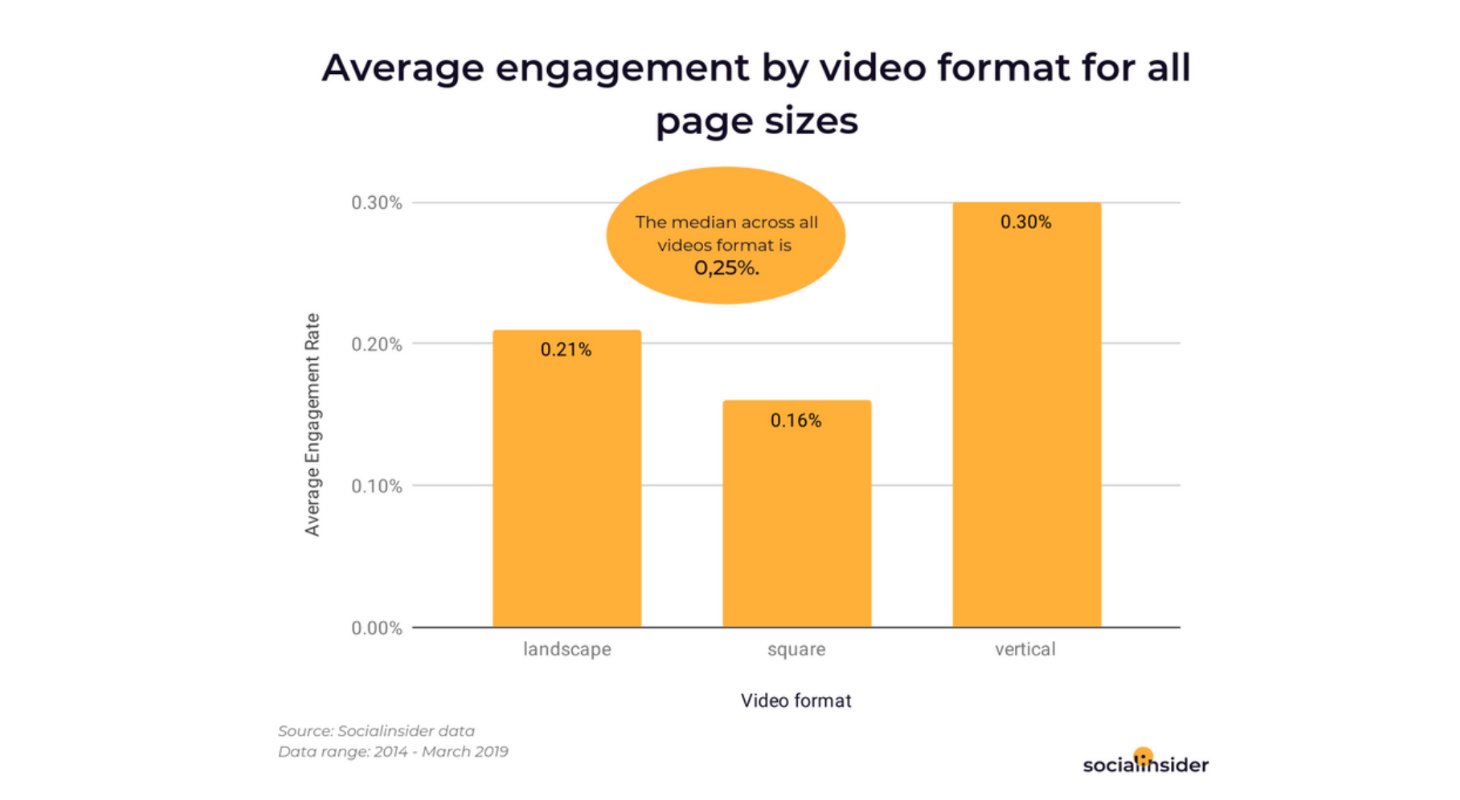
3.3. Vertical videos outperform landscape video in engagement for all page sizes
According to our study, vertical videos outperform landscape video in engagement for all page sizes with a median across all pages sizes of 0.25%.
Take a look at the graphic below.

3.4. 85% of Facebook videos are watched without sound
According to Digiday, brands should reconsider their strategy when creating videos for Facebook because 9 in 10 of people watch videos without sounds. Marketers should create content tailored to the Facebook platform because:
- adding captions in video increase the time watch with 12%
- 80% of people react negatively when a video plays loudly without warning.
4. Facebook advertising stats
Every marketer wants to benchmark its marketing actions on Facebook to get more value of every dollar or minute spent on this platform.
Measuring is the key to understand if it's a suitable platform for your business.
Our Facebook ads study shows some key Facebook statistics every marketer should know.
4.1. The average CPM and CPC on Facebook are around $5.31 and $0.43, respectively
Our complex Facebook ads analysis revealed that the average CPC on Facebook ads is $0.43, while the average CPM on Facebook Ads is $5.31.

After a decline that started around November 2019, both CPM and CPC have been slowly rising since March-April 2020.
4.2. CTR has spiked in June 2020 to 3.41%
The same Facebook ads study showed that the average click-through rate on Facebook and Instagram has spiked to 3.41% in June 2020, but has been declining in the following months, reaching 3.01% in August.

4.3. Facebook ads have the highest CTR
This results on Facebook ads show that choosing to place ads primarily on Facebook is the best strategy, as the click-through rate is through the roof compared to other channels - a staggering 3.90%, while the CTRs on Instagram, Audience Network, and Messenger fall under 1%.

The median CTR is 2.52%, which translates into the fact that 50% of those Facebook ads obtain a click-through rate of over 2.52%.
4.4. 93% of marketers use Facebook advertising regularly
Many marketers are unsure about their Facebook marketing actions. A study from Social Media Examiner confirms that Facebook advertising dominates because 93% of marketers use Facebook advertising regularly. Moreover, 54% of marketers claim Facebook is their most important social platform.
Below are other key Facebook stats from the aforementioned study:
- Facebook Live is the leading live video platform used by 30% of marketers
- Facebook ads are used by 75% of marketers
- 61% of marketers find the Facebook ads platform the most important for ads
Final thoughts
It is really important to understand the different statistics that make Facebook the leading social media platform.
Knowing Facebook statistics can help you create a better Facebook marketing strategy for your brand in 2021 and beyond. Also, these Facebook stats will help you increase engagement, reach new goals, and engage with your audience.
Related articles
- 10 Most Important Facebook KPIs You Should Track And Monitor
- [Study]: 101,421,493 Posts Show How To Write The Best Content On Facebook vs. Instagram vs. Twitter In 2020
- How To Create High Performing Videos On Facebook
- How To Use The 4 Superpowers Of Facebook’s Analytics Tool
* This article was originally published here
No comments:
Post a Comment