Thursday, March 20, 2025

X (Twitter) stats that marketers need to know in 2025

Whether you call it X or Twitter (as you’ll see in stat #21, many people still do), there’s no question that this particular social platform is in a period of significant change. As you’ll see in stat 24, that has some brands questioning the platform’s ROI.

But advertiser numbers that dropped off a year and a half ago are picking back up again, as are ad revenues. For brands with an active audience on X, there’s real opportunity to connect and build community.

So: Is that your brand? This collection of X statistics can help you figure that out. Use these latest insights into current audience details, usage patterns, and benchmarks to inform your X marketing strategy for 2025.

  1. Gen Z is X’s biggest generational group, growing 12% since 2022. The segment also drove a 6.9% brand equity jump in Q3 2024. This means brands on X can target young people with entertaining content in a space less saturated by brand competitors.
  2. X users watched 8.3 billion videos daily in 2024, a 40% YoY increase, as the platform pushes a TikTok-like experience with its new video tab. Yet, only 5.5% of marketers use X for influencer campaigns, far behind TikTok (58.9%) and Instagram (35.2%). This gap presents an opportunity for early adopters to leverage video and influencer partnerships on X at potentially lower costs in a less saturated market.
  3. X accounts average 61 posts/week, with impressions up to 2,121 per post in 2024. Posting at 6 a.m. Monday leverages peak engagement for better reach.

General X (Twitter) stats

1. X has 611 million monthly active users

That makes it the 12th most popular social media platform in the world, ranking behind the Chinese platforms Douyin and Kuaishou, but ahead of Pinterest.

2. X is the 10th most popular social platform in the United States

In the U.S, the platform ranks just behind Reddit. For context, Pew Research Center found that 21% of Americans say they ever use X, compared to 70% for Facebook and 50% for Instagram.

which social media platforms are most popular among US adults

Source: Pew Research Center

3. The most followed X account is @ElonMusk

As of this writing, Musk has 219 million followers. Barack Obama is in second place with 130.7 million.

Cristiano Ronaldo, Justin Bieber, and Rihanna round out the top 5.

4. eMarketer predicts X will lose 10 million users worldwide in 2025

And another 10 million in 2026. Within the United States, they expect the number of users to drop 3.8% in 2025 and another 3.5% in 2026.

internet users of any age who access their X account via any device at least once per month

Source: eMarketer

That said…

5. There were 137,136,000 unique U.S. visitors to X in October 2024

Which is actually slightly higher than the number a year earlier. U.S. visitors to the platform varied between 135,736 and 146,674 per month over the preceding 12 months, but never took an ongoing downturn.

US unique visitors to X and Bluesky Oct 2023 to Oct 2024

Source: eMarketer

These two X (Twitter) statistics combined suggest that predictions about X’s future are rather tricky at the moment. Smart marketers will keep an eye on their metrics in X (Twitter) analytics and put a social listening strategy in place to track the volume and context of relevant conversations on this evolving social network.

6. X.com is the fifth-most visited website worldwide

It ranks behind Google, YouTube, Facebook, and Instagram. But the average visit to the X website is 00:12:40, longer than any of those sites except YouTube (00:20:43)

X benchmarks for marketers

7. The average organic X engagement rate is 1.7% for the entertainment and media industry

That’s the highest rate among all available industries tracked in the latest original data from Hootsuite and Critical Truth. The lowest engagement rate by industry is 0.9%, which is the rate for consumer goods retail, marketing agencies, and real estate.

The overall engagement rate is 1.6%.

engagement rates industry overall various social platforms

Not sure what your average engagement rate is? Find out with our free engagement rate calculator, or try Hootsuite and let it crunch your numbers and tell you how to improve — automatically.

8. The overall weekly follower growth rate on X is 0.11%

In the chart below, this looks like a dramatically lower rate than TikTok and Instagram. But keep in mind that in Q4 2024, there was significant uncertainty and media attention about the future of TikTok. This clearly impacted the follower count numbers for both TikTok and Instagram. Their third quarter growth numbers are a more realistic comparison.

weekly follower growth overall industry

9. The average weekly posting frequency on X is 61

That is significantly higher than on any other platform. This reflects the nature of X as a primarily text-based platform with a low character count.

weekly posting frequency overall industry various social media platforms

10. The optimum number of posts per week for minimum engagement is 6

Overall engagement is fairly consistent, though, from 2 to 9 posts (aka Tweets) and then starts to drop off from there.

X weekly frequency and engagement rate

11. The average number of impressions per X post is 2121.13

That’s a significant increase from 1206.55 in 2023. So is that a big deal? We’ve got a detailed blog post breaking down the importance of impressions (and reach) to help you understand what impressions mean for your ROI.

average number of impressions of posts on X in 2023 and 2024

Source: Statista

X audience demographic stats

12. There are 106.23 million X users in the United States

That makes the U.S. the country with the largest X user base. It’s followed by Japan (69.28 million) and India (25.45 million).

leading countries based on number of X users as of April 2024

Source: Statista

13. 38% of U.S. adults aged 18-29 use X

It’s easy to assume that Gen Z only cares about TikTok, but they’re by far the largest generation on X. In fact, X internal data shows a 12% increase in Gen Z users from 2022 to 2024.

The next-largest group of users is 30- to 49-year-olds. 25% of Americans in that age group use X.

14. X saw a 6.9% quarterly increase of brand equity among Gen z users in Q3 2024

That put the platform at the top of the Ad Age-Harris poll rankings Gen Z poll released in November 2024.

AdAge 20 brands catching Gen Z's attention right now

Source: AdAge via XBusiness

15. 25% of American men use X, but only 17% of women

This indicates that marketers specifically targeting a male audience may wish to invest more effort in the platform. By contrast, Facebook, Instagram, Pinterest, and TikTok all have more female users than male.

16. 27% of Americans who make $100,000 per year or more use X

That’s the largest percentage of any income group. Still, it pales in comparison to the 70% of Americans in this income category who use Facebook and 58% who use Instagram.

X use is not hugely varied across income categories. Between 15 and 24% of Americans in all income categories under $99,999 also use the platform.

17. 27% of Americans who have a college degree use X

That’s more than double the usage of those with high school or less, 13% of whom use the platform.

18. 23% of Americans who live in the suburbs use X

Along with 22% of those who live in cities. Only 15% of rural Americans use the platform.

X usage statistics

19. In total, people spent 364 billion active seconds per day on X in 2024

That’s six billion minutes, an increase of 10% from 2023. They also watched 8.3 billion videos every day on X in 2024, a 40% year-over-year increase. If you’re not yet posting videos on X, it’s worth testing this increasingly popular type of content.

20. 81% of U.S. X users use the platform because it’s entertaining

You may be surprised to learn that’s the top reason people say they use the platform. Getting news is the second reason (65%), followed by connecting with others who share similar interests (62%).

most users are on X because it's entertaining but majorities also use it for politics and news

Source: Pew Research Center

21. 55% of daily American X users still refer to the platform as Twitter

As do 49% of all American adults. Only 19% of daily active users in the U.S. refer to the platform as X, while 21% use both names interchangeably.

Half of Americans still refer to X as Twitter

Source: YouGov

In the United Kingdom, even more people still use the old name: 80% of all UK users and 78% of daily UK users say they refer to the platform only as Twitter.

The rebranding appears to still be a work in progress. It’s a tricky linguistic road to navigate, which is why we still often include the original name when we talk about the platform.

22. The top emoji used on X in 2024 was the loudly crying face, posted 2.1 billion times

The face with tears of joy ranked third, with 1.5 billion posts. Whether the tears were happy or sad, people did not hesitate to share them on X.

23. The top topic on X in 2024 was sports

That was followed by movies & TV, politics, technology, and music. The conversation about the Super Bowl alone drove 13 million posts, 4.5 billion impressions, and 511 million video views, much of it happening in real time.

X for business stats

24. Only 38% of social marketers are confident they get positive ROI from X

And that’s for those who use social listening. Among marketers without a social listening plan in place, only 27% are confident in the platform’s ROI.

Percentage of social listeners vs non listeners that feel confident in the ROI of each platform

Source: Hootsuite

25. The best time to post on X is 6 a.m. Monday

Best time to post on X for engagement

Tuesday between 3 and 6 a.m. is also a high-engagement time on the platform, as is Sunday around midnight.

This is an overall finding across industries. You can find the best times to post for your industry in Hootsuite Analytics, and for your specific account using Hootsuite’s Best Time to Publish feature.

26. 29% of American X users use the platform to look at product reviews or recommendations

This is a smaller percentage than on other major social platforms, but it is nonetheless significant – more than a quarter of U.S users are researching products on X. If you haven’t already, it’s worth developing a plan to include X in your ecommerce strategy.

X advertising stats

27. X will account for 0.2% of digital ad spend in 2025

That’s according to eMarketer forecasts. It sounds miniscule, but remember that this is the percentage of all digital ad spend, not just social media ads. For context, Facebook will account for 14.6% of total digital ad spend.

28. 5.5% of marketers use X for influencer campaigns

This text-forward platform is just not as conducive to promoting influencer partnerships. For comparison, 58.9% of marketers use TikTok for influencer marketing and 35.2% use Instagram.

That said, the smaller number of influencer campaigns on the platform creates a unique opportunity for brands whose audience is active on the platform.

29. X advertising revenue increased 123% y-o-y in December 2024

That’s partly based on a return to ads on the platform by major brands like Apple and Amazon, which paused their advertising campaigns on the platform about a year and a half ago.

30. There were more than 1.7 million ad campaigns on X in 2024

Those campaigns were created by more than 250,000 advertisers globally. Want to join them? We’ve got a blog post with everything you need to know about advertising on X.

How to use X stats to inform your strategy

1. Reconsider your picture of who uses the platform

Would you have expected Gen Z to be the biggest X user base? Or for X to have topped a brand equity survey among this age group?

It’s easy for brands with a young target audience to focus on TikTok and/or Instagram. But your audience is likely also on X, and your niche may not be as saturated on this platform.

2. Get motivated to dive into your X analytics

Marketers are uncertain about X ROI. But opportunities exist to drive conversions from X, with 29% of American users looking for product reviews and recommendations on the platform.

Becoming more confident in your ability to convert your X efforts into real business KPIs requires you to spend some time with your X analytics. Look at what types of content are already working for you, and do some testing to try to improve your results.

As you develop your content strategy, remember that people primarily use the platform for entertainment. Test tweets that explicitly promote your products or services, but don’t overdo it.

And remember that direct conversions are not the only social actions that contribute to ROI. A tool like Hootsuite Advanced Analytics can help you understand the ROI of X metrics at all stages of the customer journey.

3. Consider adding video to your X content strategy

The number of video views increased 40% last year. In January, X launched a dedicated video tab for U.S. users. This new home for fullscreen video aims to create a user experience similar to TikTok or Reels.

There may be opportunity here for brands that are early to engage with this new focus on video. It’s also worth examining how this impacts the ability to work with influencers on the platform. Since only 5.5% of marketers are currently using X for influencer partnerships, there’s a chance to try this strategy in an unsaturated marketplace where the upfront investment may be lower.

Build a smart X marketing strategy by using Hootsuite to plan, schedule, and publish Tweets, engage with users, and track topics and hashtags. Combined with powerful Twitter analytics, Hootsuite is your perfect partner for success on the platform and all other networks.

The post X (Twitter) stats that marketers need to know in 2025 appeared first on Social Media Marketing & Management Dashboard.


* This article was originally published here

Wednesday, March 19, 2025

36 Instagram statistics marketers need to know in 2025

Reaching two billion people every month, Instagram is a critical component of any brand’s digital marketing strategy. But it’s a tricky platform to pin down, since it’s known for algorithm changes and a constant influx of new or adjusted features.

Here, you’ll find an in-depth look at the most relevant and up-to-date Instagram stats so you can understand who’s using the platform now, what they’re looking for, and how you can best engage them.

But first…

  1. Instagram is a global powerhouse with a young, engaged audience. With 2 billion monthly active users, it’s the third biggest social platform globally. Its demographic stats scream opportunity: 72% of U.S. teens and 76% of 18-29-year-olds are on it, making it the go-to spot for Gen Z. If your brand’s chasing younger audiences, this is your playground.
  2. Engagement’s solid, but strategy matters. The average overall engagement rate on the platform sits at 2.0%, with carousels crushing it at 2.4%. But less is more when it comes to posting. Some retailers post as many as 17 times a week, but it’s brands that update their feeds twice a week that see the best engagement, TL;DR? Quality over quantity, and lean into carousels.
  3. Instagram isn’t just fun — it’s a hub for shopping and search. Sure, 86% of users are there for entertainment, but 36% are using Instagram like Google, and 7% start their shopping searches there. With ad revenue projected at $67.27 billion in 2025 and 40.1% of Instagram shoppers already dropping over $200 a year, this platform’s a goldmine for ecommerce. Time to test those shopping features and explore Instagram SEO!

General Instagram stats

1. Instagram is the world’s third most-used social platform (tied with WhatsApp)

Instagram and WhatsApp both have 2,000,000,0000 active users worldwide as of April 2024. The most-used platform? Facebook, with more than 3 billion monthly active users.

2. Instagram also has the 4th most-visited website in the world

According to SimilarWeb, as of February 2025, Instagram.com is the fourth most-visited website globally, behind Google, YouTube, and Facebook. The average visit length is 8:38, which shows that people are using Instagram’s web presence to view content.

3. The most popular Instagram account is… @Instagram

…with 685 million followers. Cristiano Ronaldo comes in a close second (649M), followed by Leo Messi (504M), Selena Gomez (421M), and Dwayne Johnson (394M).

4. Instagram has 2 billion active monthly users

That’s about two-thirds of Facebook’s monthly active user base (3.065 billion).

Instagram benchmarks for marketers

5. The average engagement rate for Instagram is 2.0%

However, this varies significantly by industry. Healthcare has the lowest engagement at 1.6%, with government having the highest (3.2%). Retail comes in at 1.8%

Not sure where you stand? Try our engagement rate calculator here.

engagement rates overall industry for various social platforms

6. Carousels have the highest engagement rate at 2.4%

This is unchanged from last quarter, whereas Reels and photos both saw minor drops in engagement rate over that time.

best content type for engagement overall industry carousels reels and photos

7. The average Instagram weekly follower growth rate was 14.7% in Q4 2024

However, that is a huge change from the previous quarter, when it was just 0.55%. This is likely a blip caused by concerns about the future of TikTok. The Q3 figure is a more realistic benchmark to target.

weekly follower growth industry overall

8. The average Instagram posting frequency is 4.5 per week

That’s the lowest of the social media platforms examined in research by Hootsuite and Critical Truth. Keep in mind that this varies by industry, with retail brands posting the most at an average of 8.2 times per week.

weekly posting frequency graph

9. The optimum number of Instagram posts per week is 2

Brands may be posting more than they need to. Accounts that post 2x per week get the highest engagement. However, note that retail again is an exception. For consumer good retail, the optimum number of posts is a whopping 17.

instagram weekly frequency and engagement rate

Instagram audience demographic stats

10. India has the most Instagram users: 362.9 million

The United States is next with 169.6 million Instagram users. Brazil is third with 134.6 million. These statistics highlight that Instagram is a global channel with excellent potential for reaching international markets.

11. 72% of U.S. residents aged 15 to 17 use Instagram

Instagram remains a valuable platform for reaching younger audiences. It’s actually the preferred platform for this age group, followed by TikTok at 68%.

12. 76% of U.S. adults aged 18-29 use Instagram

That’s the highest-use age group for the platform. 66% of U.S. adults ages 20-49 use the platform, followed by 26% of those ages 50-64 and 19% of those ages 65+.

13. 58% of Americans who earn more than $100k/year use Instagram

That’s the largest percentage of any income bracket. 54% of those who earn $70k-$99.9k use the platform, followed by 47% of those who earn $30k-$69.9k and 41% of those who earn less than $30k.

14. 55% of U.S. Instagram users are female

And 45% are male. (These were the only gender options provided.)

15. Less than a third (32.2%) of Instagram users are aged 35 or older

And only 7.5% are aged 55 or older. You’re much more likely to reach Gen Z on the platform than Gen X or even older Millennials.

Distribution of Instagram users worldwide by age group

Source: Statista

16. Instagram is the preferred social network of U.S. internet users aged 13-28

Despite all the TikTok hype, Instagram is the most-used social network for Generation Z.

penetration of select digital platforms among US Gen Z 2024

Source: eMarketer

Instagram usage stats

17. 50% of U.S adults use Instagram

That puts it third behind YouTube and Facebook. For now, American adults still use Meta products much more than TikTok, Pinterest, and other platforms.

survey of US adults social media platform popularity 2012-2024

Source: Pew Research Center

18. 50% of U.S. teenagers use Instagram at least once a day

12% of U.S. teens visit their Instagram profiles “almost constantly,” and 28% use it several times per day. Of note for marketers: More teens say they use Instagram daily than Snapchat, which is a change from last year.

roughly three quarters of teens visit YouTube daily around 6 in 10 say this about TikTok

Source: Pew Research

19. U.S. Instagram users spend an average of 16 minutes a day on the app

Users aged 18 to 24 spend the most time on the app, at 43 minutes per day. It goes down from there with every age increment, to just 3 minutes per day for those age 65+.

average daily time spent with social networks by US adults by age 2024

Source: eMarketer

20. 86% of U.S. Instagrammers use the platform because it’s entertaining

entertainment and keeping up with friends and family main reasons for daily Instagram use

Source: Pew Research Center

That’s the most important reason people use the platform. This means your content had better be entertaining if you expect people to watch or engage. In our social media strategy guide, we recommend using 80% of your content to educate, inform, or entertain your audience.

21. 36% of people use Instagram as a search tool

Specifically, they say they search for information on Instagram the same way they would on Google. This represents a significant shift in Instagram use and makes it more important than ever for marketers to understand Instagram SEO.

22. 7% of U.S. consumers start their search on Instagram when online shopping

The number of people who specifically use Instagram to start a shopping search is significantly lower than the number who use it to search for information. But this is still significant for marketers because these are people actively looking to buy a product. Facebook is the only social platform where more people begin their online shopping search (10%).

Bonus!!!

Get our 2025 Social Media Trends report for the insights you need to reach your goals in what’s shaping up to be social’s best year yet.

Instagram advertising stats

23. Instagram’s ad revenue will reach $67.27 billion in 2025

Instagram ads rank second for revenue among all social platforms and fourth in the list of all companies with digital ad revenue (behind Google, Facebook, and Amazon).

companies with over 10 billion in net digital ad revenues worldwide 2025

Source: eMarketer

24. U.S. marketers will spend $2.56 billion on Instagram influencer marketing in 2024

That’s more than double what they’ll spend on Facebook. And more U.S. marketers use Reels than TikTok for influencer marketing, according to eMarketer.

Instagram Stories stats

25. Instagram Stories have an average reach of 0.91 users

Yes, the average Instagram Story is seen by less than one person. Compare that to 11 users per Reel and 7.8 users per carousel.

This is not shocking, given that Stories are generally only seen by your Instagram followers. Adam Mosseri said Stories should be considered as a subset of your Instagram presence to reach your most passionate fans.

average user reach per post on Instagram from 2023 to 2024 by format

Source: Statista

26. 71.9% of brand content on Instagram appears in Stories

This is by far the most common type of brand content posted. In fact, Stories are the most used format on the platform overall, by a long shot. Accounts with a follower count of more than 50k post an average of 46 Stories per week.

Instagram Reels stats

27. Video accounts for more than 60% of the time people spend on Instagram

You need a solid Reels strategy to have the best chance of reaching your audience on the platform. Perhaps even more important in terms of getting your content to new audiences…

28. Reels are reshared more than 4.5 billion times per day

With shares taking the lead as the most important engagement metric, that means engaging Reels are one of the best ways to connect with your audience and provide real value.

29. For Reels to be recommended to non-followers, they need to be less than 3 minutes long

You can still create longer Reels if your content justifies that, but know that they will not be recommended to non-followers.

Instagram statistics for business

30. The best time to post on Instagram varies significantly by day of the week

Hootsuite’s original research with Critical Truth shows that the best time for Instagram business accounts to post for maximum engagement is a little too complicated to sum up in a single line. So, we’ve put it into this handy chart.

best time to post on instagram for engagement

Keep in mind that this is overall data, and the best time to post can vary significantly by industry. We’ve got a whole blog post with the details for each industry. Or, use the Best Time to Publish feature in Hootsuite to get custom recommendations for your specific account.

31. The optimal number of hashtags on Instagram is 3 to 5

The maximum number is 30, but that would be … a lot. We suggest using far fewer and making sure you also understand Instagram SEO.

32. Instagram ranks second for ROI confidence

At least, that’s the case for marketers without a social listening strategy. For those that do have social listening in place, Instagram ties for ROI confidence with LinkedIn at 76%.

percentage of social listeners vs non listeners that feel confident in the ROI of each platform

Source: Hootsuite Social Trends 2025 Report

33. 44% of U.S. Instagrammers use the app to look at product reviews or recommendations

For marketers, this means you need to pay attention to what other people are saying about your brand. A social listening strategy can help. It’s also good motivation to seek out brand ambassadors and influencers who can share first-hand experiences of using your products or working with your company.

34. 40.1% of Instagram social shoppers spend more than $200/year on the platform

That’s significantly higher than on Facebook, Pinterest, or TikTok. It also ranks highest for people spending more than $700/year at 8.7%. However, note that TikTok has the highest percentage of people who spend $1000/year or more.

average amount US social shoppers spend on social purchases by platform March 2024

Source: eMarketer

35. Fashion brands are the top search category on Instagram (12%)

11% of the total Instagram user base searches for hair and makeup, and 10% search for interior design. It’s a logical breakdown since this primarily visual platform works well to showcase design-oriented brands.

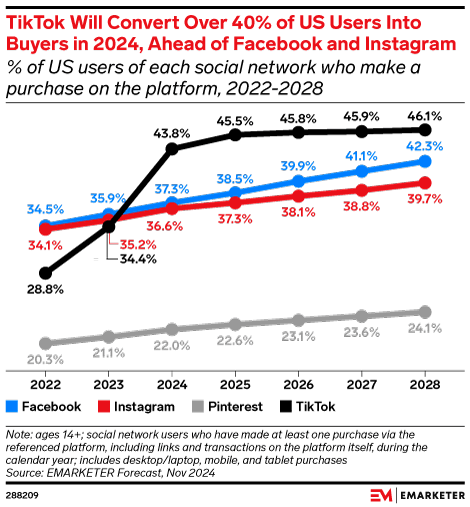
36. 37.3% of U.S. Instagram users will make purchases via the platform in 2025

That puts it third for social platforms, behind TikTok and Facebook (but just barely).

TikTok will convert over 40 percent of US users into buyers in 2024 ahead of Facebook and Instagram

Source: eMarketer

How to use Instagram stats to inform your strategy

1. Analyze the Instagram demographics for a match with your target audience

But go beyond the obvious. Half of all U.S. adults use the platform. There’s greater penetration in Gen Z than Gen X, but look beyond age to get a clearer picture of audience fit.

Consider that Instagram’s user base skews female, has a high income level, and is into fashion. These details can help you build an audience persona that helps guide your content strategy even if you’re not directly operating in the fashion space.

2. Benchmark your performance to identify strengths, weaknesses, and opportunities

We’ve included some benchmarking statistics in this post to give you a sense of what kinds of engagement rates and posting frequency you should aim for. To get more personalized insights to inform your strategy, dig into your specific Instagram account statistics as part of a competitive analysis.

Hootsuite’s benchmarking and competitive analysis tools give you the full picture of how your Instagram statistics stack up. You’ll even get recommendations on how to improve.

3. Lean into Instagram as an ecommerce tool

The ecommerce and social shopping statistics for Instagram are very promising. People are using this platform to search for and research products. And they’re putting their money where their searches are.

Yes, social media often functions best as a relationship-building tool rather than a direct conversion machine. But these statistics provide good motivation to at least test Instragram shopping features if you’re not already doing so.

4. Remember why people are there

The number-one reason people use Instagram is because it’s entertaining. So ask yourself: Is your Instagram content entertaining? If there’s one thing you test this quarter, make it a stretch into more entertaining content.

Creative disruption is one of Hootsuite’s top social trends for 2025, and the Instagram statistics provide good reason to put it into action. Forty-three percent of brands have tried out a new tone of voice, personality, or persona on social in the last year. If you’re feeling nervous about venturing outside your usual brand guidelines, Instagram Stories provide a relatively safe testing ground since the content disappears after 24 hours.

Save time managing Instagram for business using Hootsuite. From a single dashboard, you can create, schedule and publish posts directly to Instagram, engage your audience, measure performance and run all your other social media profiles. Try it free today.

The post 36 Instagram statistics marketers need to know in 2025 appeared first on Social Media Marketing & Management Dashboard.


* This article was originally published here

Sunday, March 16, 2025

How often should a business post on social media? [2025 data]

It’s the question that launched a thousand sleepless nights: “How often should a business post on social media?”

Of course, like anything worth knowing, there’s no simple answer to this question. Social media platforms are constantly updating their algorithms, adding new features, and changing the rules of engagement. What worked last year may not work this year, and what works today might become obsolete tomorrow.

We dug into the research and grilled our social media team, and some outside experts, for insights to discover the ideal number of times a day (or week) to post for each platform.

How often to post on social media in 2025

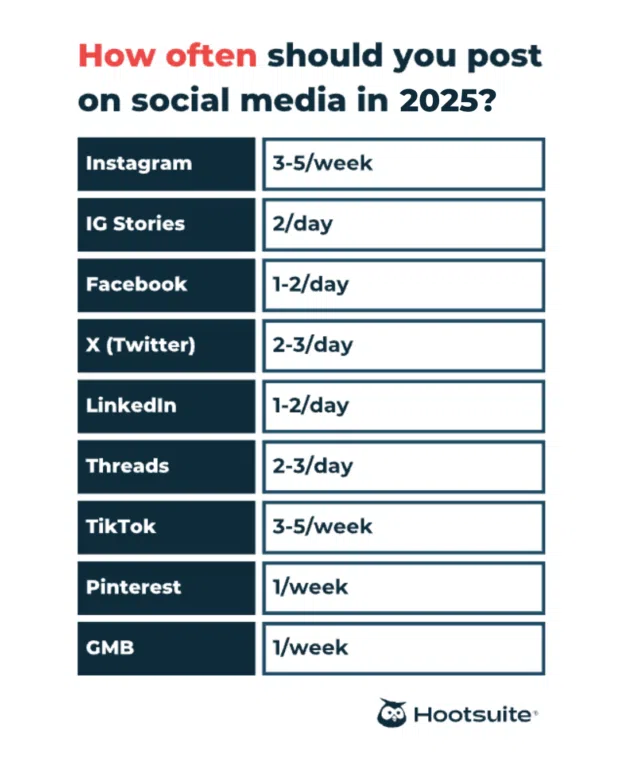
Wondering how often to post to social media for business in 2025? While every channel has its own specifications, having an always-on presence is generally your ticket to online success.

How often to post on social media in 2025 by platform Hootsuite infographic

Here’s a quick summary of what we found:

  • Instagram: Post between 3 and 5 times per week.
  • Instagram Stories: Post 2 times per day.
  • Facebook: Post between 1 to 2 times per day.
  • X (Twitter): Post between 2 and 3 times per day.
  • LinkedIn: Post between 1 to 2 times per day.
  • Threads: Post between 2 to 3 times per day.
  • TikTok: Post between 3 and 5 times per week.
  • Pinterest: Post at least 1 time per week.
  • Google My Business: Post at least 1 time per week.

These findings come from a theoretical approach: We researched best practices, listened to what social platform executives had to say, and chatted with our network of social media managers.

But we also measured how often real businesses actually post on social media.

Weekly posting frequency across all industries: Facebook, Instagram, X (Twitter), LinkedIn, TikTok, Q3 & Q4 2024

In Q1 of 2025, here’s how often businesses are posting on social media:

  • X (formerly Twitter): 61 times per week
  • Facebook: 7.9 times per week
  • Instagram: 4.5 times per week
  • LinkedIn: 5.0 times per week
  • TikTok: 11.5 times per week

How often to post on Instagram

Post 3-5 times per week on Instagram.

Our experts recommend creating at minimum, three posts per week on Instagram. Ideally, these are mixed media posts (carousels, reels, static posts, etc.) Using different social media content types is especially important if you post more than three times per week.

Instagram Stories can be used more frequently, though Instagram’s own Adam Mosseri recommends 2 Stories per day.

Posting frequently on Instagram increases your chances of showing up in the Explore feed, being featured on another account, or appearing in the top search results for keywords you commonly use. Posting regularly is also a great way to test out what resonates with your audience.

Posting too often will not lose you followers, adds Mosseri. In fact, the more you post, the more chances you have to be discovered. While you don’t need to stress yourself unnecessarily, don’t be afraid to post more often — if you have the capacity.

Hootsuite Social Media Manager Trish Riswick says that smaller social media teams shouldn’t be put off by this relatively high posting demand. Quality should always come before quantity, she says, adding, “If your social team does not have the ability to post once a day on each network, aim for every other day. Three quality posts are worth more than five low-quality posts.”

If you think that an algorithmically controlled timeline means post-timing doesn’t matter, think again. Our experiments have proven that post timing does have an impact on Instagram engagement…

… and so does posting frequency:

Instagram weekly posting frequency and engagement rate, all industries: Q3 & Q4 2024 data

Our data confirms Trish’s words: two good posts a week will get you more overall engagement than 20 pieces of mediocre content — and 6 to 7 great posts per week is the sweet spot.

#1 Social media tool

Create. Schedule. Publish. Engage. Measure. Win.

Free 30-day trial

How often to post on TikTok

Post 3-5 times per week. Or, as much as you can.

While TikTok actually recommends posting 1-4 times per day, they also say there is no limit to the amount of organic content small businesses can create.

Obviously, that level of constant posting may not be realistic for everyone. If you’re just getting started, 3-5 times per week is a great place to start. According to social media manager Brayden Cohen, “TikTok is the place to test content and see what sticks or flops.”

The TikTok algorithm is tricky, but the more you post on a regular basis, the more likely you are to get in front of a larger audience and see what works well. Aim to post 3-5 times per week so that you’re consistently staying in front of your followers. With each post, track the video views, engagement, and amount of time a viewer spends watching your video to get a better idea of how effective it is.

TikTok weekly posting frequency and engagement rate, all industries: Q3 & Q4 2024 data

How often to post on Facebook

Post 1-2 times per day on Facebook.

Organic reach is down everywhere, but Facebook seems to be the hardest hit. Currently, the average Facebook page post engagement rate sits at less than 1%. These numbers aren’t expected to perk up anytime soon.

Our experts recommend posting 1-2 times per day on Facebook. This should help you stay present in the minds of your audience, but not go so far as to overwhelm their feeds.

Facebook weekly posting frequency and engagement rate, all industries: Q3 & Q4 2024 data

But again, remember that quality matters more than quantity. Research shows that two great posts a week can generate solid engagement on your account.

How often to post on X (Twitter)

Post 2-3 times per day on X (Twitter).

Things move fast on Twitter. This news-centric platform means Tweets have a short lifespan. So, you’ll need to post a little more often than you do on other channels.

There are plenty of power users out there. Some accounts are posting 50 or 100 times a day. If you’ve got the time, we’re certainly not going to stop you. But, to keep your brand’s presence active and engaged on Twitter, you really don’t need to drop everything and commit to a full-time gig Tweeting.

In fact, for the general @Hootsuite channel (where the audience is followers, customers, and prospects), the Hootsuite team posts 2-3 times per day.

Life as a SMM: pic.twitter.com/WnMRGnRuWN

— Hootsuite 🦉 (@hootsuite) April 11, 2025

Remember that, however frequently you’re posting, the best practice is to follow the rule of thirds:

  • ⅓ of Tweets promote your business
  • ⅓ share personal stories
  • ⅓ are informative insights from experts or influencers

Keep in mind, engaging with your audience or other community partners is a big play with posting frequency too!

How often to post on LinkedIn

Post 1-2 times per day on LinkedIn.

LinkedIn itself says companies that post weekly see a 2x life in content engagement. They also recommend posting at least once a day, even on weekends. Oh, and they say scheduling your posts with [amazing] partners like Hootsuite is the way to go. Hey, that’s not a promo, it’s literally in their documentation. You can’t argue the facts!

Keep in mind, LinkedIn content can live in user feeds for a long, long time. This is because when someone engages with your post, it will begin to show up in their connections’ news feeds. Additionally, users can filter the feed by “top” and “recent” content, which could increase the longevity of your posts if they go viral.

Quality over quantity matters here, so it’s important to craft interesting, engaging content that is timely and relevant. Right now, LinkedIn feed filters are changing and you’ll soon be able to filter your feed for topics like “video-specific content.”

Trish Rishwick also recommends varying your content types when posting on LinkedIn. “I would avoid posting two PDFs [in one day]. Instead I might do 1 PDF and 1 poll.” This will help you see better results from multiple daily posts.

Hootsuite’s LinkedIn account tends to fall on the more-frequent end of the posting spectrum. We generally post 2-3 times per day, and sometimes up to 5 times per day, depending on campaigns and events.

And that’s okay! Don’t worry about overwhelming your LinkedIn audience — they’re some of the most engaged social media users around. As long as your content is relevant, you can post away (up to 18 times per week, according to our data!).

LinkedIn weekly posting frequency and engagement rate, all industries: Q3 & Q4 2024 data

Don’t forget: Hootsuite Analytics can help ensure your posting strategy is aligned with your engagement goals.

hootsuite analytics dashboard showing post impressions and reach for various social media channels

How often to post on Threads

Post 2-3 times per day on Threads.

Like it’s closely related (but never imitated, right?) platform X, Threads thrives on fast-moving, short-form content. Immediacy is the name of the game here, so don’t be afraid to post frequently, at least 2-3 times a day.

Paige Schmidt of the Hootsuite social team says, “A good rule of thumb [on Threads] is to post 2 to 3 times per day. While you definitely can post more than that, I wouldn’t recommend less!”

When thinking about what to post, Paige says to keep in mind the conversational and inclusive nature of the Threads platform. “Act like your followers are your best friends and care what they’re talking about or what they reply to your posts with,” she says. Community engagement can be just as important as posting new content, as it signals to your customers that you’re available and listening.

Pro Tip: New to community engagement? See where you stand with this free engagement calculator.

New posts should be uplifting and fun, and showcase the unique personality of your brand. “Don’t be scared to humanize your brand,” says Paige. “We often talk about the struggles in our industry but in a fun and creative way.” Here’s an example of what she means.

Still, Paige says it’s important to focus on post quality, rather than simply quantity. “Brain dumps are one thing,” says Paige, “but make sure it’s still relevant and will resonate with your audience. There’s no sense in posting randomly just because you have a post quota you need to make.”

Key Threads statistics to keep in mind when posting:

How often to post on Pinterest

Post at least 1 time per week on Pinterest.

According to Pinterest, “Quality and relevance matter more than frequency on Pinterest. So while you can determine the best schedule for you, posting on a weekly basis is a good rule of thumb.”

Unlike platforms like Instagram and TikTok, virality isn’t the goal on Pinterest.

Content on Pinterest has a long shelf life. One post can be viewed and shared for weeks or even months after it’s been posted. That’s why creating content with high engagement and relevance is more important than going viral.

To optimize your posts, make sure to follow the creative best practices such as:

Depending on your goals, you may want to post multiple times each week. How frequently you post will depend on the type of content you’re sharing and the size of your audience. Your Pin stats is a great place to review Pin performance and see how your audience is interacting with certain content types.

Hootsuite Advanced Analytics can also help draw lines between how Pinterest content is affecting web traffic, or how an uptick in followers translates to views on other platforms.

Key Pinterest statistics to keep in mind when posting:

Check out the latest Pinterest statistics for business and Pinterest demographics to inform your Pinning strategy.

How often to post on Google My Business

Post at least 1 time per week on Google My Business.

Google My Business posts might not be the first thing that comes to mind when you think about social media for business. But, this platform can be surprisingly effective at helping your local SEO and boosting customer engagement.

Google My Business posts used to expire after 7 days. But, in 2021, Google changed this feature and you’ll now see the last 10 published posts. Google does note that posts are archived after 6 months unless otherwise specified.

Posts on Google My Business need to be incredibly timely. Generally, your audience is looking for something they can do, see, or eat, right now. So, posts should focus on current offers or events.

various google my business posts by mila restaurant promoting their daily deals

The ideal posting frequency for Google My Business depends on the type of post, but generally, it’s recommended to post at least once per week. You can also break up your posts into different times of day and days of the week based on when your target audience is online.

Current offers, images of your business location or space, and new product announcements tend to do well on this platform.

Key Google My Business statistics to keep in mind when posting:

Learn how to get more customers with Google My Business.

Social media posting frequency: Q1 2025 data for 12 industries

Construction, mining, and manufacturing

  • Facebook: 2.5 posts per week
  • Instagram: 3.1 posts per week
  • LinkedIn: 3.7 posts per week
Weekly posting frequency in the construction, mining, and manufacturing industry: Facebook, Instagram, LinkedIn, Q3 & Q4 2024

Consumer goods and retail

  • Facebook: 8.1 posts per week
  • Instagram: 8.2 posts per week
Weekly posting frequency in the consumer goods and retail industry: Facebook, Instagram, Q3 & Q4 2024

Dining, hospitality, and tourism

  • Facebook: 6.8 posts per week
  • Instagram: 3.3 posts per week
Weekly posting frequency in the dining, hospitality, and tourism industry: Facebook, Instagram, Q3 & Q4 2024

Education

  • Facebook: 4 posts per week
Weekly posting frequency in the education sector: Facebook, Q3 & Q4 2024

Financial services

  • Facebook: 2.8 posts per week
  • Instagram: 2.9 posts per week
  • LinkedIn: 2.7 posts per week
  • X (Twitter): 2.3 posts per week
Weekly posting frequency in the financial services industry: Facebook, Instagram, X (Twitter), LinkedIn, Q3 & Q4 2024

Government

  • X (Twitter): 5.5 posts per week
  • Facebook: 8.7 posts per week
  • Instagram: 2.8 posts per week
  • LinkedIn: 7.0 posts per week
Weekly posting frequency in the government sector: Facebook, Instagram, X (Twitter), LinkedIn, Q3 & Q4 2024

Healthcare, pharma, and biotech

  • Facebook: 4.2 posts per week
  • Instagram: 4.7 posts per week
  • X (Twitter): 4.0 posts per week
  • LinkedIn: 3.1 posts per week
Weekly posting frequency in the healthcare, pharma, and biotech industry: Facebook, Instagram, X (Twitter), LinkedIn, TikTok, Q3 & Q4 2024

Marketing agencies

  • Facebook: 4.8 posts per week
  • X (Twitter): 13.6 posts per week
Weekly posting frequency in marketing agencies: Facebook, X (Twitter), Q3 & Q4 2024

Nonprofit

  • X (Twitter): 4.3 posts per week
  • Facebook: 5.3 posts per week
  • LinkedIn: 8.8 posts per week
  • Instagram: 2 posts per week
Weekly posting frequency in nonprofit: Facebook, Instagram, X (Twitter), LinkedIn, TikTok, Q3 & Q4 2024

Real estate, legal, and professional services

  • X (Twitter): 12.6 posts per week
  • Facebook: 6 posts per week
  • Instagram: 2 posts per week
  • LinkedIn: 11.1 posts per week

For more real estate social media statistics, check this out.

Weekly posting frequency in professional services: Facebook, Instagram, X (Twitter), LinkedIn, TikTok, Q3 & Q4 2024

Technology

  • LinkedIn: 2.6 posts per week
Weekly posting frequency in the technology industry: LinkedIn, Q3 & Q4 2024

Utilities and energy

  • Facebook: 2.6 posts per week
  • Instagram: 2.6 posts per week
  • LinkedIn: 2.3 posts per week
Weekly posting frequency in the utilities and energy industry: Facebook, Instagram, LinkedIn, Q3 & Q4 2024

How to know the best posting frequency for social media

Knowing how often should a business post on social media requires some trial and error. What’s good for some brands may not work for others.

Enterprise teams will be able to post more frequently than individual entrepreneurs. As well, individual traits like audience size, community loyalty, geographic location, and content type can dramatically impact the performance of your posts.

Brayden Cohen says, “To see what is best for you, try testing different posts at different times and different quantities to see what drives the best performance for your content and channel. Continue to test, learn, and pivot.”

Always remember: the quality of content matters more than frequency. While posting more content may help to some extent, the more relevant and useful your content is to the audience, the better your social channels will perform.

And, don’t forget to track how your content performs week over week. Trish Rishwick says that brands posting twice in one day should check how their first and second posts perform differently. If one is better than the other, this might be a sign to only post once a day on that network, Or, to focus on a specific content type over another.

How to schedule social media posts

Ready to streamline your social media game across all platforms? Hootsuite’s scheduling feature is here to make your life easier, whether you’re posting on Instagram, Facebook, Twitter, LinkedIn, TikTok, YouTube, or Pinterest.

Here’s how to schedule social media posts with Hootsuite.

1. Connect your social media accounts to Hootsuite

Before diving into scheduling, ensure your social media accounts are connected to Hootsuite.

Head to your Hootsuite dashboard and navigate to your profile icon in the bottom left corner. From there, select Manage accounts and teams and connect your desired platforms, including Instagram, Facebook, Twitter, and more.

hootsuite dashboard screen prompting user to reconnect or add social media accounts

2. Create your posts

Once your accounts are connected, it’s time to draft your post.

To begin, click on the pen icon on the left side of your Hootsuite dashboard, where it says Composer. Then, choose Post from the dropdown menu (or Pin if you’re publishing to Pinterest).

arrow pointing to composer icon on left side of hootsuite dashboard

Now, choose the social media account you’d like to publish to. You can also select multiple accounts and optimize your posts for each platform later on.

hootsuite composer drop down showing connected social media accounts that you can create posts for

Here, you can add your copy, images, links, files, and more. If you’re stumped on what to write, use Owly Writer AI to generate brand-ready content in just a few clicks.

hootsuite composer showing fields for copy, images, and media

Once your post is drafted, include any relevant stakeholders who might need to approve or edit the post before it goes live. You can add them in just below the Content section.

ask for approval section of hootsuite composer with drop down menu for adding team members

You can also include boosts and promotions on your post, using Hootsuite Boost, in the event you want to put a little money behind it to increase reach.

promotion box in hootsuite composer with check box if you want to promote the post

If you’re scheduling for multiple accounts, be sure to optimize your post by toggling between the accounts in Composer.

arrow pointing to where to toggle between social accounts in hootsuite composer

3. Choose the best time to post

From here, you’ll want to choose a time to publish your post. This should be a time when your audience is most likely to be online, and when you’ve seen the most engagement in the past.

Hootsuite’s Best Time to Post feature can be found in the Composer. Just click Schedule for later, and you’ll see recommended times suggested to you on-screen.

hootsuite best time to publish feature shown in composer

Or, choose Analytics from the sidebar navigation and then Best time to publish underneath Organic reporting. Here, you’ll see heat maps that show when your unique audience is most online. These are available for all of your connected channels.

hootsuite heatmap showing best times to post for instagram audience

You can also check out this blog on the best times to post on every channel for more insights.

4. Schedule your post

Once your post is drafted and you know when you want it to go live, you can schedule your post directly in Hootsuite.

Choose Schedule to send your post live immediately. Or, choose Schedule for later to post it sometime in the future.

Now your post is in the queue!

5. View your content calendar

If you want to review your scheduled posts, make adjustments, or see your content at a glance, head over to the Hootsuite Planner.

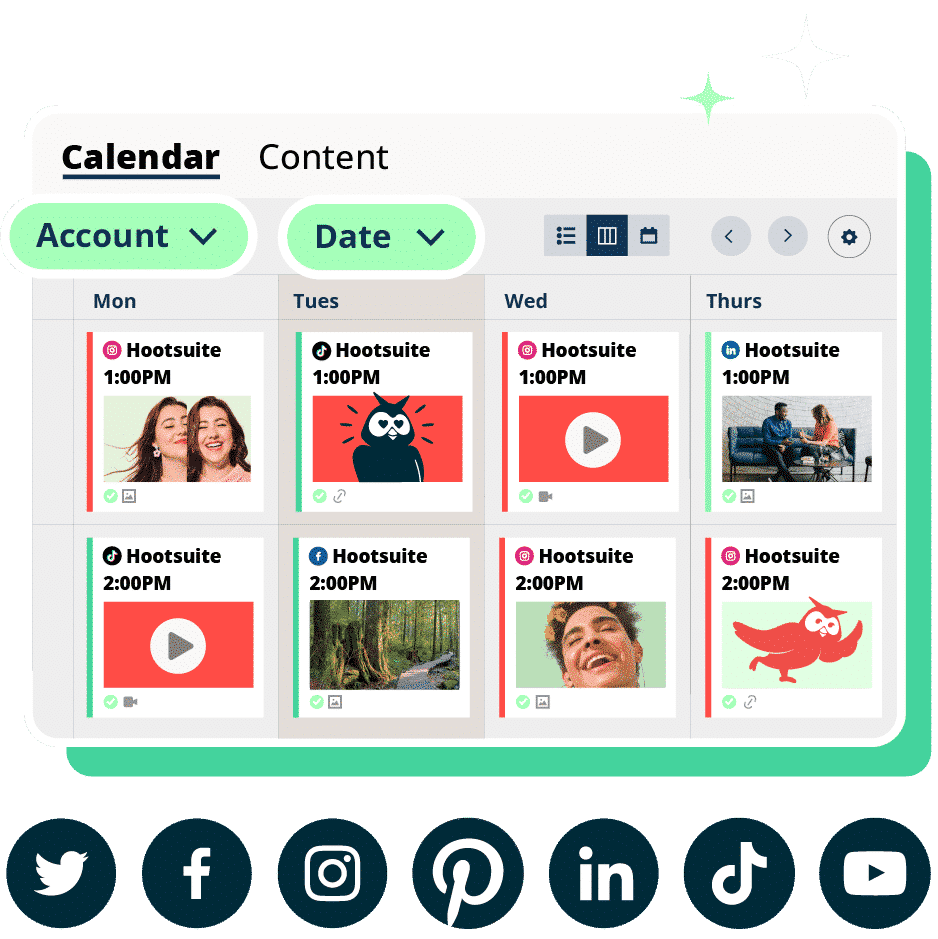
Here, you’ll see all of your scheduled posts in a social media calendar view. To edit your posts, simply click on them and make any adjustments in Composer.

various social media posts shown in calendar format in hootsuite planner

Use Hootsuite to schedule and publish all of your social media posts at the best times, engage with your followers, and track the success of your efforts. Sign up for a free trial today.

The post How often should a business post on social media? [2025 data] appeared first on Social Media Marketing & Management Dashboard.


* This article was originally published here

Best Social Media Stocks To Watch Today - October 24th - MarketBeat

Best Social Media Stocks To Watch Today - October 24th    MarketBeat * This article was originally published here